Номер / задача 29 страница 12, ГДЗ по алгебре за 9 класс к учебнику Никольского
Задача 29
а) \(x + 2 > 0\)
Рассмотрим прямую \(y = x + 2\). Здесь \(k = 1 > 0\), \(b = 2\).
Найдём точку пересечения с осью \(Ox\): \(0 = x + 2\), откуда \(x_0 = -2\). Точка \(A(-2;\,0)\).
Вторая точка — пересечение с осью \(Oy\): \(B(0;\,2)\).
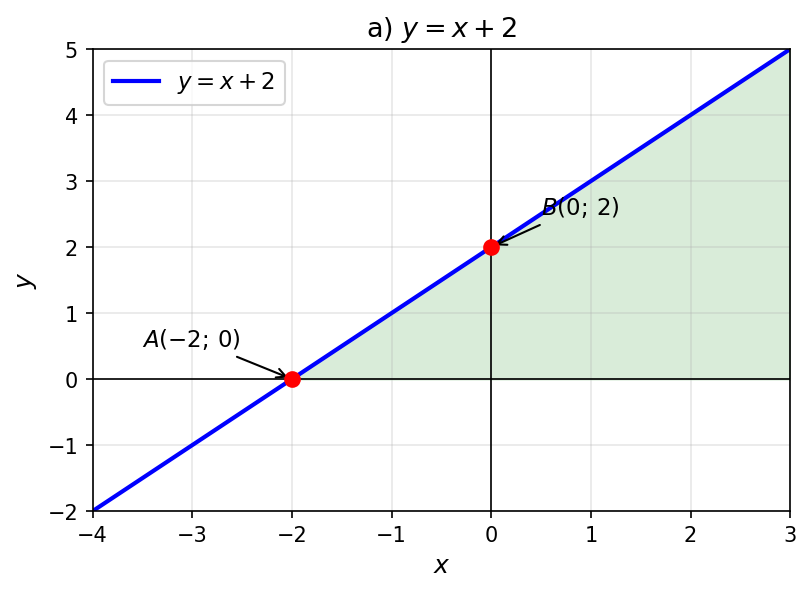
Так как \(k > 0\), точки прямой расположены выше оси \(Ox\) при \(x > x_0\).
Ответ: \((-2;\,+\infty)\).
б) \(-x + 2 > 0\)
Рассмотрим прямую \(y = -x + 2\). Здесь \(k = -1 < 0\), \(b = 2\).
Точка пересечения с осью \(Ox\): \(0 = -x + 2\), откуда \(x_0 = 2\). Точка \(A(2;\,0)\).
Вторая точка: \(B(0;\,2)\).
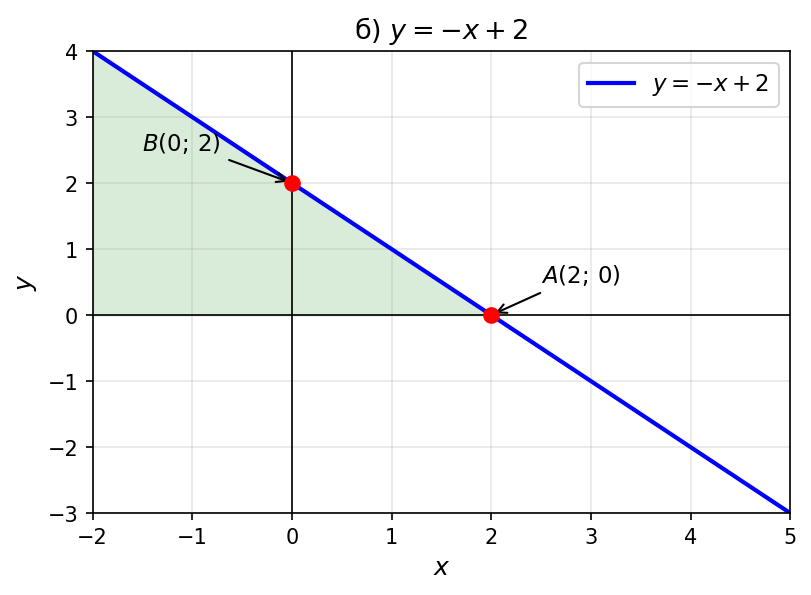
Так как \(k < 0\), точки прямой расположены выше оси \(Ox\) при \(x < x_0\).
Ответ: \((-\infty;\,2)\).
в) \(2x - 1 < 0\)
Рассмотрим прямую \(y = 2x - 1\). Здесь \(k = 2 > 0\), \(b = -1\).
Точка пересечения с осью \(Ox\): \(0 = 2x - 1\), откуда \(x_0 = \frac{1}{2}\). Точка \(A\!\left(\frac{1}{2};\,0\right)\).
Вторая точка: \(B(0;\,-1)\).
import matplotlib.pyplot as plt
import numpy as np

fig, ax = plt.subplots(figsize=(6, 4))
x = np.linspace(-2, 3, 300)
y = 2*x - 1
ax.plot(x, y, 'b-', linewidth=2, label='\(y = 2x - 1\)')
ax.axhline(0, color='k', linewidth=0.8)
ax.axvline(0, color='k', linewidth=0.8)
ax.plot(0.5, 0, 'ro', markersize=7, zorder=5)
ax.plot(0, -1, 'ro', markersize=7, zorder=5)
ax.annotate(r'\(A\left(\frac{1}{2};\,0\right)\)', xy=(0.5, 0), xytext=(1.2, 0.8), fontsize=11, arrowprops=dict(arrowstyle='->'))
ax.annotate('\(B(0;\,-1)\)', xy=(0, -1), xytext=(-1.8, -1.5), fontsize=11, arrowprops=dict(arrowstyle='->'))
ax.fill_between(x, y, 0, where=(y < 0), alpha=0.15, color='red')
ax.set_xlabel('\(x\)', fontsize=12)
ax.set_ylabel('\(y\)', fontsize=12)
ax.set_title('в) \(y = 2x - 1\)', fontsize=13)
ax.legend(fontsize=11)
ax.grid(True, alpha=0.3)
ax.set_xlim(-2, 3)
ax.set_ylim(-4, 4)
plt.savefig(OUTPUT_PATH, dpi=150, bbox_inches='tight')
plt.close()
Так как \(k > 0\), точки прямой расположены ниже оси \(Ox\) при \(x < x_0\).
Ответ: \(\left(-\infty;\,\dfrac{1}{2}\right)\).
г) \(-2x - 1 < 0\)
Рассмотрим прямую \(y = -2x - 1\). Здесь \(k = -2 < 0\), \(b = -1\).
Точка пересечения с осью \(Ox\): \(0 = -2x - 1\), откуда \(x_0 = -\frac{1}{2}\). Точка \(A\!\left(-\frac{1}{2};\,0\right)\).
Вторая точка: \(B(0;\,-1)\).
import matplotlib.pyplot as plt
import numpy as np

fig, ax = plt.subplots(figsize=(6, 4))
x = np.linspace(-3, 2, 300)
y = -2*x - 1
ax.plot(x, y, 'b-', linewidth=2, label='\(y = -2x - 1\)')
ax.axhline(0, color='k', linewidth=0.8)
ax.axvline(0, color='k', linewidth=0.8)
ax.plot(-0.5, 0, 'ro', markersize=7, zorder=5)
ax.plot(0, -1, 'ro', markersize=7, zorder=5)
ax.annotate(r'\(A\left(-\frac{1}{2};\,0\right)\)', xy=(-0.5, 0), xytext=(-2.5, 1.5), fontsize=11, arrowprops=dict(arrowstyle='->'))
ax.annotate('\(B(0;\,-1)\)', xy=(0, -1), xytext=(0.5, -2), fontsize=11, arrowprops=dict(arrowstyle='->'))
ax.fill_between(x, y, 0, where=(y < 0), alpha=0.15, color='red')
ax.set_xlabel('\(x\)', fontsize=12)
ax.set_ylabel('\(y\)', fontsize=12)
ax.set_title('г) \(y = -2x - 1\)', fontsize=13)
ax.legend(fontsize=11)
ax.grid(True, alpha=0.3)
ax.set_xlim(-3, 2)
ax.set_ylim(-3, 5)
plt.savefig(OUTPUT_PATH, dpi=150, bbox_inches='tight')
plt.close()
Так как \(k < 0\), точки прямой расположены ниже оси \(Ox\) при \(x > x_0\).
Ответ: \(\left(-\dfrac{1}{2};\,+\infty\right)\).
д) \(0{,}2x + 1 > 0\)
Рассмотрим прямую \(y = 0{,}2x + 1\). Здесь \(k = 0{,}2 > 0\), \(b = 1\).
Точка пересечения с осью \(Ox\): \(0 = 0{,}2x + 1\), откуда \(x_0 = -5\). Точка \(A(-5;\,0)\).
Вторая точка: \(B(0;\,1)\).
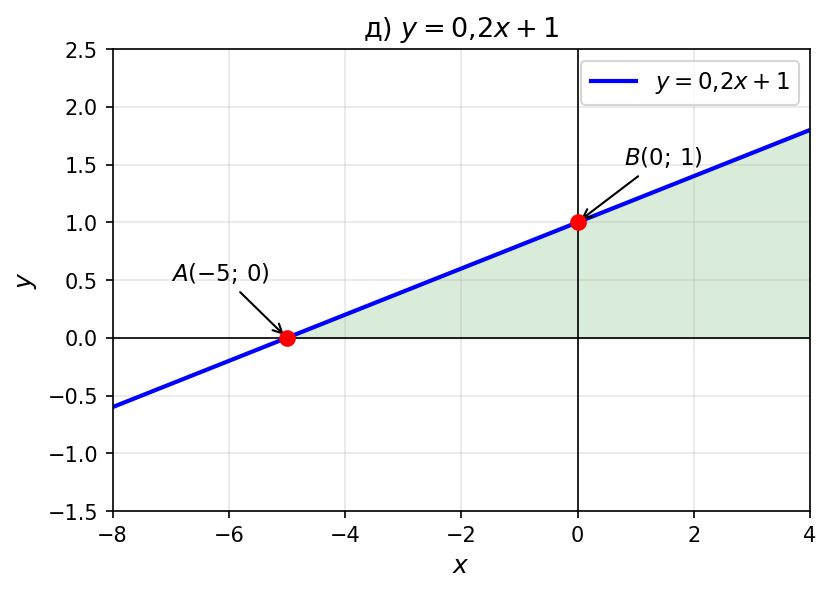
Так как \(k > 0\), точки прямой расположены выше оси \(Ox\) при \(x > x_0\).
Ответ: \((-5;\,+\infty)\).
е) \(-\dfrac{1}{3}x + 5 < 0\)
Рассмотрим прямую \(y = -\dfrac{1}{3}x + 5\). Здесь \(k = -\dfrac{1}{3} < 0\), \(b = 5\).
Точка пересечения с осью \(Ox\): \(0 = -\dfrac{1}{3}x + 5\), откуда \(x_0 = 15\). Точка \(A(15;\,0)\).
Вторая точка: \(B(0;\,5)\).
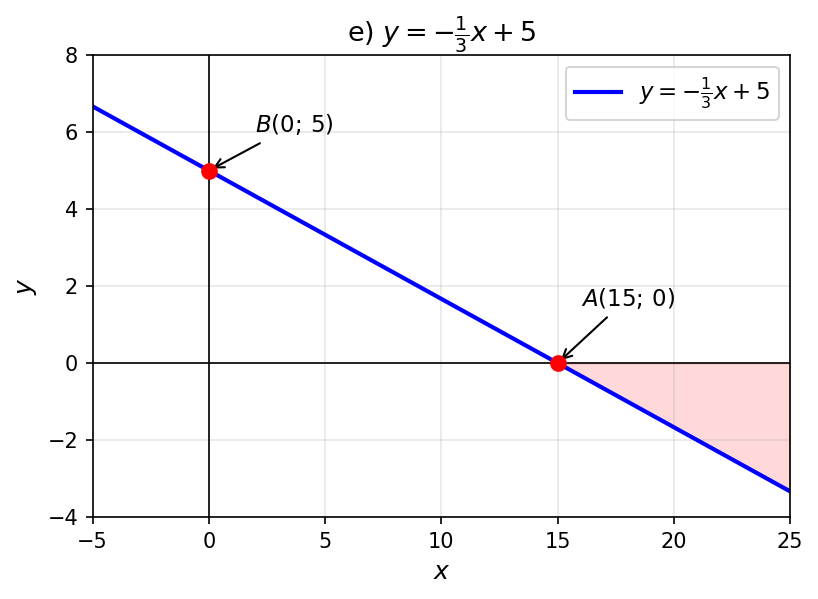
Так как \(k < 0\), точки прямой расположены ниже оси \(Ox\) при \(x > x_0\).
Ответ: \((15;\,+\infty)\).
ж) \(400x + 100 > 0\)
Рассмотрим прямую \(y = 400x + 100\). Здесь \(k = 400 > 0\), \(b = 100\).
Точка пересечения с осью \(Ox\): \(0 = 400x + 100\), откуда:
\[x_0 = -\frac{100}{400} = -\frac{1}{4}.\]
Точка \(A\!\left(-\frac{1}{4};\,0\right)\).
Вторая точка: \(B(0;\,100)\).
import matplotlib.pyplot as plt
import numpy as np

fig, ax = plt.subplots(figsize=(6, 4))
x = np.linspace(-0.8, 0.5, 300)
y = 400*x + 100
ax.plot(x, y, 'b-', linewidth=2, label='\(y = 400x + 100\)')
ax.axhline(0, color='k', linewidth=0.8)
ax.axvline(0, color='k', linewidth=0.8)
ax.plot(-0.25, 0, 'ro', markersize=7, zorder=5)
ax.plot(0, 100, 'ro', markersize=7, zorder=5)
ax.annotate(r'\(A\left(-\frac{1}{4};\,0\right)\)', xy=(-0.25, 0), xytext=(-0.7, 50), fontsize=11, arrowprops=dict(arrowstyle='->'))
ax.annotate('\(B(0;\,100)\)', xy=(0, 100), xytext=(0.1, 130), fontsize=11, arrowprops=dict(arrowstyle='->'))
ax.fill_between(x, y, 0, where=(y > 0), alpha=0.15, color='green')
ax.set_xlabel('\(x\)', fontsize=12)
ax.set_ylabel('\(y\)', fontsize=12)
ax.set_title('ж) \(y = 400x + 100\)', fontsize=13)
ax.legend(fontsize=11)
ax.grid(True, alpha=0.3)
ax.set_xlim(-0.8, 0.5)
ax.set_ylim(-200, 250)
plt.savefig(OUTPUT_PATH, dpi=150, bbox_inches='tight')
plt.close()
Так как \(k > 0\), точки прямой расположены выше оси \(Ox\) при \(x > x_0\).
Ответ: \(\left(-\dfrac{1}{4};\,+\infty\right)\).
з) \(200x - 500 > 0\)
Рассмотрим прямую \(y = 200x - 500\). Здесь \(k = 200 > 0\), \(b = -500\).
Точка пересечения с осью \(Ox\): \(0 = 200x - 500\), откуда:
\[x_0 = \frac{500}{200} = \frac{5}{2} = 2{,}5.\]
Точка \(A(2{,}5;\,0)\).
Вторая точка: \(B(0;\,-500)\).
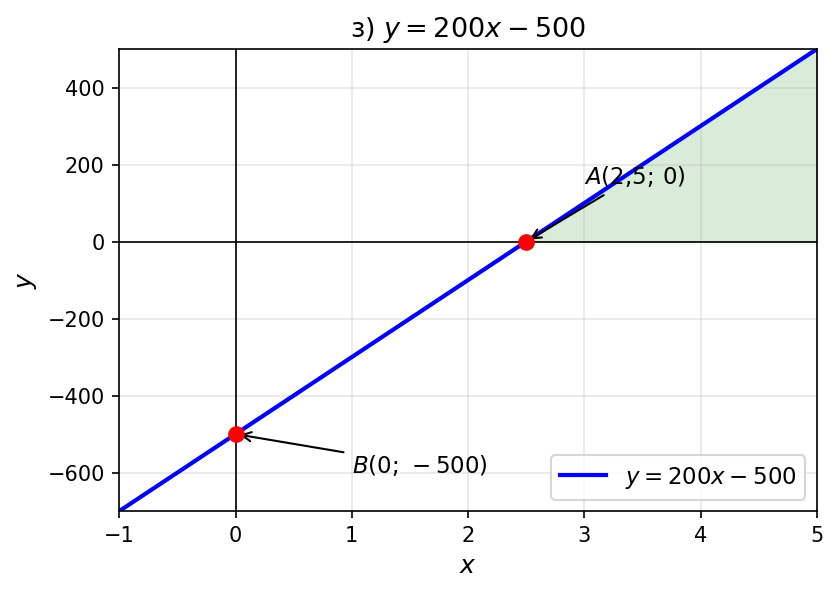
Так как \(k > 0\), точки прямой расположены выше оси \(Ox\) при \(x > x_0\).
Ответ: \((2{,}5;\,+\infty)\).
и) \(0{,}01x - 0{,}05 < 0\)
Рассмотрим прямую \(y = 0{,}01x - 0{,}05\). Здесь \(k = 0{,}01 > 0\), \(b = -0{,}05\).
Точка пересечения с осью \(Ox\): \(0 = 0{,}01x - 0{,}05\), откуда:
\[x_0 = \frac{0{,}05}{0{,}01} = 5.\]
Точка \(A(5;\,0)\).
Вторая точка: \(B(0;\,-0{,}05)\).
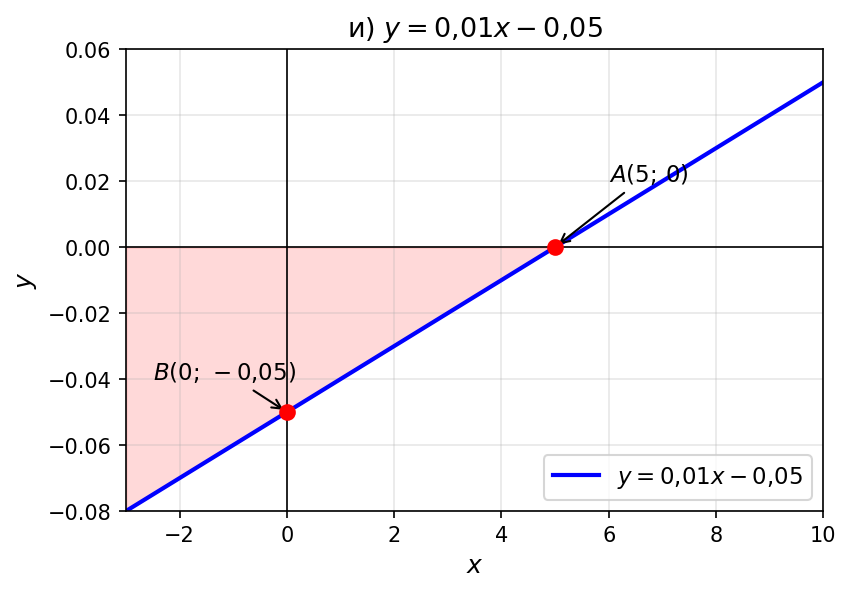
Так как \(k > 0\), точки прямой расположены ниже оси \(Ox\) при \(x < x_0\).
Ответ: \((-\infty;\,5)\).